Baselining
In addition to long term analyses to identify trends, IsarFlow provides a real baselining capability. Thereby the hourly-data of multiple weeks are aggregated to a reliable and meaningful analysis. Thus, on one hand, typical patterns are easily recognizable (the classic: traffic patterns during work days compared to weekends) and on the other hand, outliers are instantly identifiable.
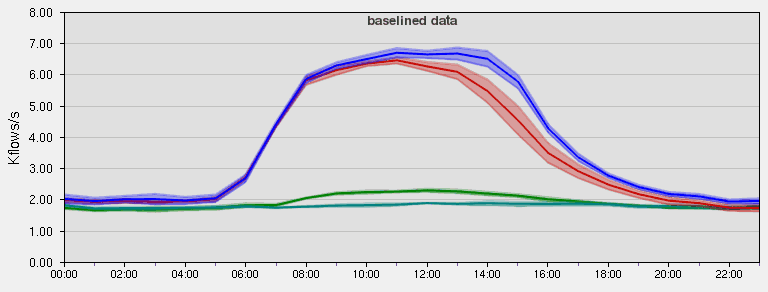
For clarification, you can find an example below where the data of a month (one line per day)
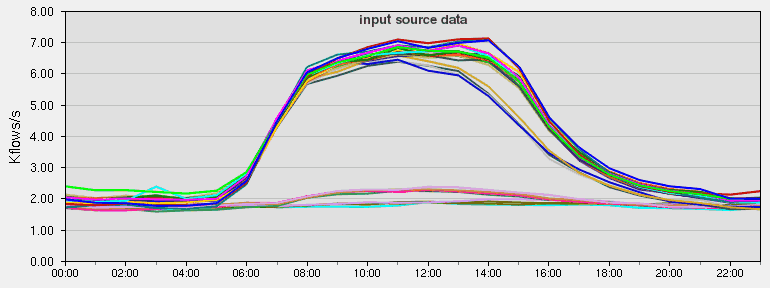
were aggregated to baselines with according variations:
A look at the calendar shows us, that typical work day - weekend traffic patterns exist in this network.
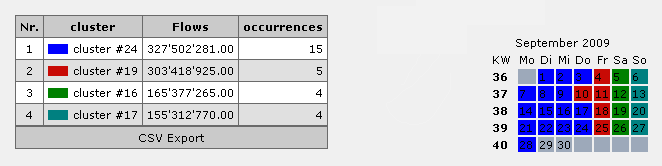
Obvious variations from normal traffic patterns become clearly visible in the above picture as well as in the calendar.